Understanding how ad trackers distribute traffic between landing pages and offers is fundamental to successful affiliate marketing and paid advertising campaigns.
Modern marketing tracking platforms use performant distribution systems that give marketers precise control over traffic flow, enabling data-driven optimization and improved campaign performance.
In this guide, we’ll explore how ad trackers distribute traffic between landing pages and offers, the mechanisms behind traffic distribution, and best practices for implementing effective tracking strategies.
What Is Traffic Distribution in Affiliate Campaign Tracking?
Traffic distribution refers to the process by which tracking software routes incoming visitors from traffic sources through landing pages and ultimately to offer destinations.
This distribution system allows marketers to:
- Test multiple landing page variations simultaneously
- Rotate between different offers automatically
- Collect performance data at each stage of the funnel
- Optimize campaigns based on real-time results
Understanding how ad trackers distribute traffic between landing pages and offers enables marketers to create more sophisticated testing frameworks and improve overall campaign ROI.
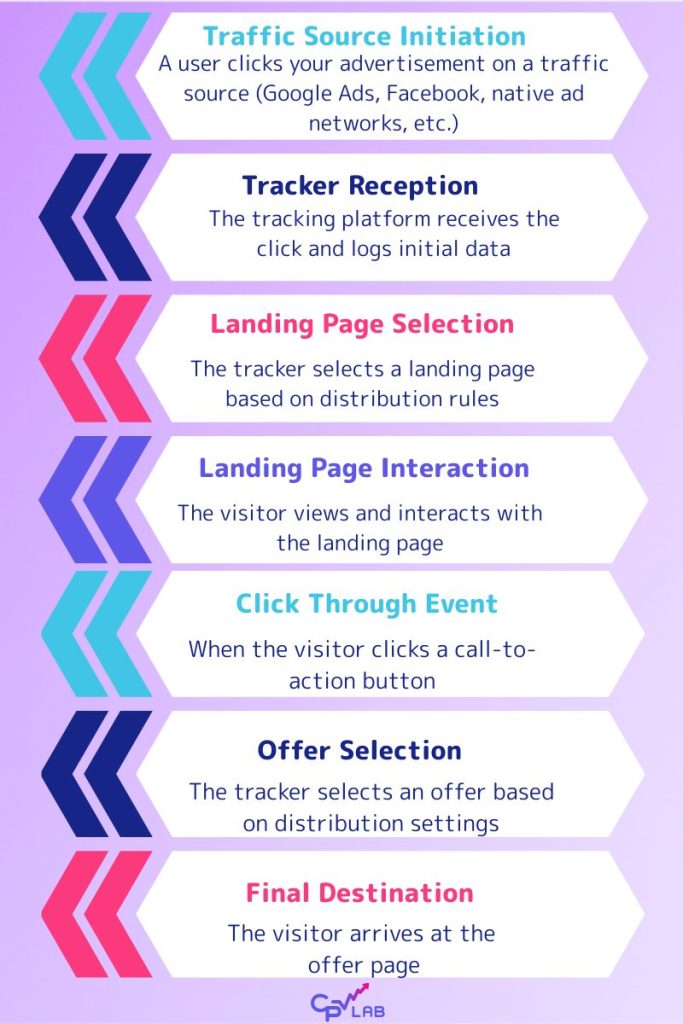
The Traffic Flow Architecture
When implementing a tracker-based campaign, traffic follows a specific path:
- Traffic Source Initiation – A user clicks your advertisement on a traffic source (Google Ads, Facebook, native ad networks, etc.)
- Tracker Reception – The tracking platform receives the click and logs initial data
- Landing Page Selection – The tracker selects a landing page based on distribution rules
- Landing Page Interaction – The visitor views and interacts with the landing page
- Click Through Event – When the visitor clicks a call-to-action button
- Offer Selection – The tracker selects an offer based on distribution settings
- Final Destination – The visitor arrives at the offer page
This architecture is how ad trackers distribute traffic between landing pages and offers in a controlled, measurable way.
The multi-stage approach provides several advantages:
- Granular tracking at each funnel stage
- Flexible testing of different combinations
- Performance isolation to identify weak points
- Conversion path optimization based on data
Landing Page Distribution Mechanisms
Weight-Based (shares%) Distribution Systems
Most modern trackers, including CPV Lab and CPV One, use a weight-based system for distributing traffic between landing pages.
Here’s how trackers distribute traffic between landing pages and offers using this method:
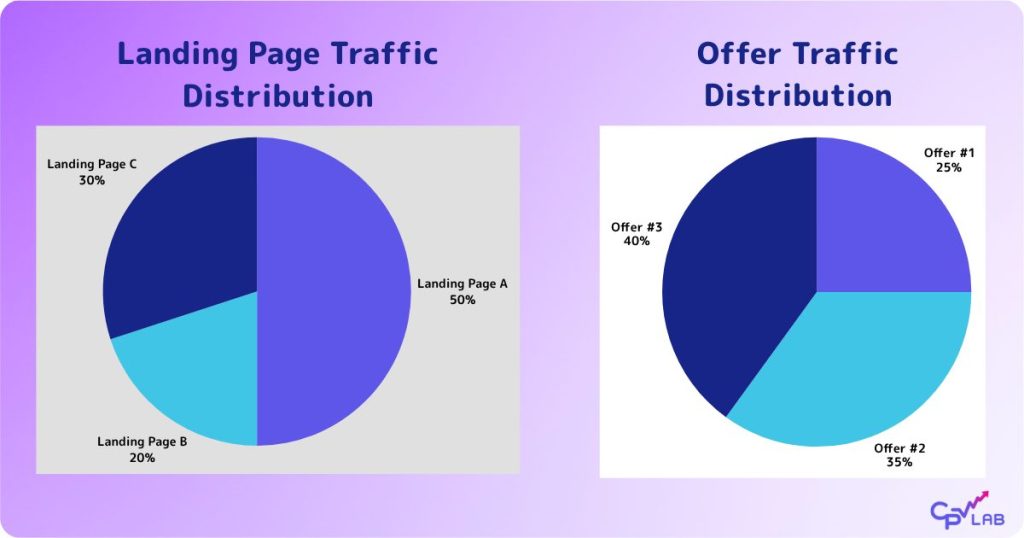
Example in a typical setup with three landing pages, you might configure:
- Landing Page A to receive 50% of traffic
- Landing Page B to receive 20%
- Landing Page C to receive 30%
- Totaling 100% of all incoming visitors
In this configuration:
- Half of incoming traffic goes to Landing Page A
- Two out of ten go to Landing Page B
- Three out of ten visitors go to Landing Page C
Offer Rotation and Distribution
After a visitor interacts with a landing page, the tracker must determine which offer to present.
How ad trackers distribute traffic between landing pages and offers at this stage depends on several factors:
Weight-Based Offer Rotation:
For example, if you have three offers in your campaign, you might allocate:
- 25% of traffic to Offer #1
- 35% to Offer #2
- 40% to Offer #3
This means that out of every 100 visitors who click through from your landing pages:
- Approximately 25 will see the first offer
- 35 will see the second offer
- 40 will see the third offer
Traffic Distribution Comparison Table
| Mechanism | Traffic Allocation | Flexibility | Best Use Case |
|---|---|---|---|
| Static Distribution | Fixed percentages (manual) | Medium | Testing consistency over time |
| Dynamic Distribution | Auto-adjusted (based on results) | High | Optimizing live campaigns |
| Sequential Rotation | Even, ordered distribution | Medium | Simple A/B testing |
| Weight-Based Rotation | Custom % per offer/landing | High | Controlled campaign flow |
| Performance-Based Rotation | Dynamic, performance-driven | High | Maximizing conversions |
Implementation: Setting Up Traffic Distribution
Step 1: Campaign Configuration
To properly implement how ad trackers distribute traffic between landing pages and offers, begin with campaign setup:
Campaign Type Selection:
CPV Lab has 6 campaign types predefined to help with an easy campaign setup.
To split test landing pages, you can choose any of the campaign types (including the Email follow-up campaign).
When you setup the campaign, in the “Tracking Settings” section, choose “Campaign type =Landing Page” to split test between landing pages.
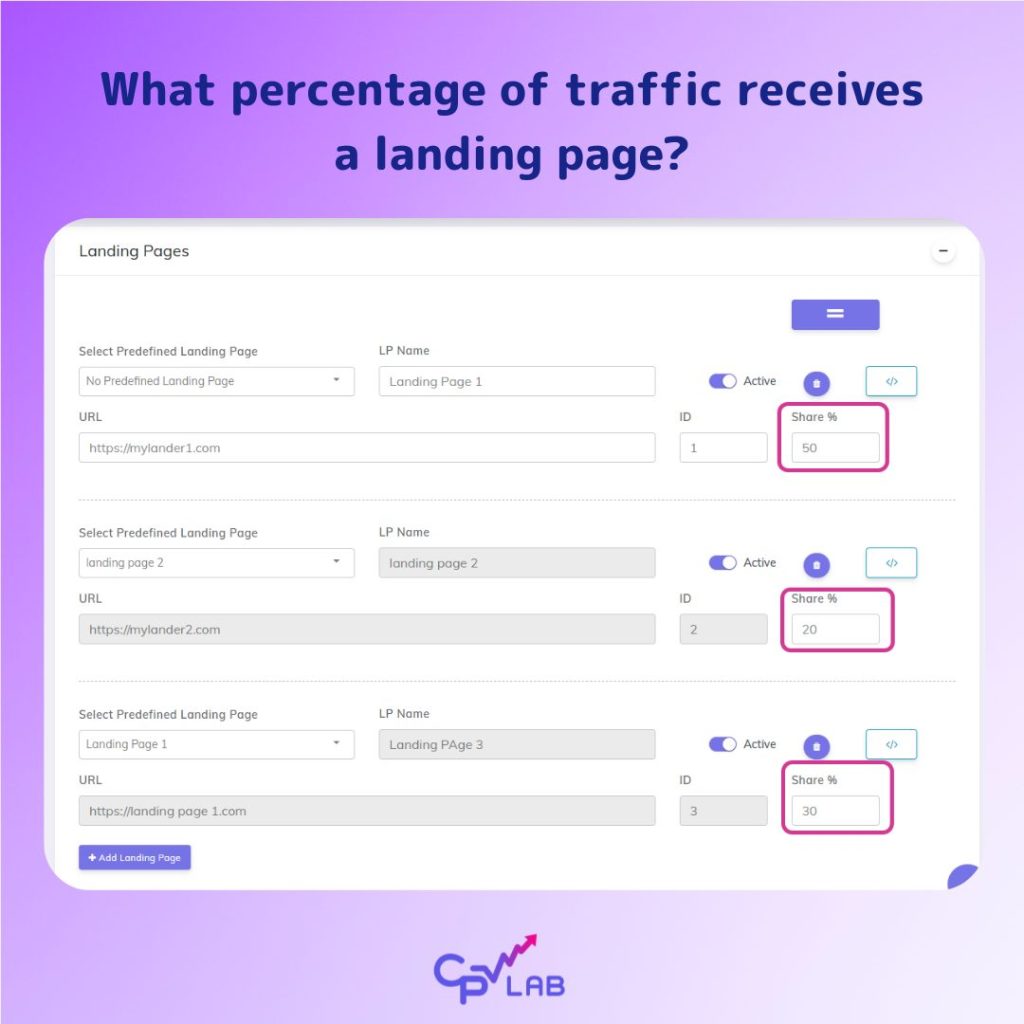
Landing Page Setup:
Each landing page configuration includes:
- A descriptive name for easy identification.
- The full URL address where the page is hosted.
- An automatically generated unique LP ID for tracking purposes.
- A share (weight) value that determines what percentage of traffic that landing page receives.
Step 2: Traffic Source Integration
Replace direct links in your traffic source with tracker campaign URLs:
Before:
https://youroffer.com/affiliate-linkAfter:
https://yourtrackerdomain.com/track/campaign-idThis integration is crucial for how trackers distribute traffic between landing pages and offers effectively.
Step 3: Landing Page Token Implementation
Update landing page links with tracking Links:
<!-- Standard HTML Link -->
<a href="<<Insert Step 1 tracking link>>" class="cta-button">
  Get Started Now
</a>

<!-- Button Element -->
<button onclick="window.location='<<Insert Step 1 tracking link>>'">
  Claim Your Discount
</button>
The “<<Insert Step 1 tracking link>>” should be replaced with the links provided in the Step 1 section from the “Links &Pixels”. In this way the ad tracker will know how to rotate the offers.
Step 4: Tracking Code Installation
Install the tracking script on each landing page before the closing </body> tag:
<!DOCTYPE html>
<html>
<head>
    <title>Your Landing Page</title>
</head>
<body>
    <!-- Landing page content -->

    <!-- Tracker Code (before </body>) -->
    <script type="text/javascript" src="https://yourdomain.com/tracker.js"></script>
</body>
</html>
This code enables comprehensive tracking of how trackers distribute traffic between landing pages and offers throughout the visitor journey.
Advanced Distribution Strategies
A/B Testing Framework
Understanding how trackers distribute traffic between landing pages and offers enables for a better A/B testing:
Equal Distribution Testing:
When testing two landing pages against each other, you would split traffic evenly:
- 50% of visitors to Landing Page A (the control version)
- 50% to Landing Page B (the variant you’re testing)
For more comprehensive testing with four different landing page variations, you could distribute traffic equally by allocating:
- 25% to Landing Page A
- 25% to Landing Page B
- 25% to Landing Page C
- 25% to Landing Page D
- Each receiving one quarter of the total traffic
Multivariate testing by using MV Lab, will let you test multiple variations of the same landing page by using One single page. In this way you can test combinations of headers, colors, texts, buttons and find the one that brings more value for your campaign.
Geographic Distribution
Advanced click trackers like CPV Lab and CPV One can distribute traffic based on visitor location:
For geographic targeting, you can set up redirect rules where:
- Visitors from the United States see a US-specific landing page exclusively
- Visitors from the United Kingdom are directed to a UK-tailored landing page
- All other international traffic goes to a general global landing page
This geotargeting approach refines how trackers distribute traffic between landing pages and offers based on visitor demographics.
Device-Based Distribution
Optimize distribution by device type can bring big ROI to your campaign.
- For mobile traffic, you might send:
- 60% of visitors to Mobile Landing Page A
- 40% to Mobile Landing Page B
- For desktop traffic, you could allocate:
- 70% to Desktop Landing Page A
- 30% to Desktop Landing Page B
- Reflecting the different performance characteristics of each device type
Time-Based Distribution (Dayparting)
Schedule different distributions for different times:
- During business hours from 9 AM to 5 PM, you might send:
- 80% of traffic to a professional-looking landing page
- 20% to a more casual design
- Then during evening hours from 5 PM to midnight, you could reverse this ratio:
- 30% to the professional page
- 70% to the casual version
- Matching the different mindsets of visitors at different times of day
Optimization Best Practices
1. Start with Even Distribution
When launching new campaigns, begin with equal weights (shares) to gather baseline data:
For example, when testing three new landing pages, start by giving each one approximately one-third of the traffic (1/3 share):
- Landing Page 1 gets 33.33% share
- Landing Page 2 gets 33.33% share
- Landing Page 3 gets 33.34% share to total exactly 100%
This approach provides unbiased data about how trackers distribute traffic between landing pages and offers in your specific campaign context.
2. Implement Statistical Significance
Before adjusting distribution weights, ensure you have statistically significant data:
- Minimum traffic threshold: 100+ clicks per variant
- Minimum conversion threshold: 10+ conversions per variant
- Confidence level: 95% or higher
3. Gradual Weight Adjustments
When optimizing how trackers distribute traffic between landing pages and offers, make incremental changes:
Week 1 (Testing Phase):
Start with equal distribution where:
- Landing Page A receives 33%
- Landing Page B receives 33%
- Landing Page C receives 34% of total traffic
Week 2 (Initial Optimization):
After analyzing performance data, adjust to send:
- 45% of traffic to Landing Page A (the best performer)
- 35% maintained for Landing Page B
- 20% to Landing Page C (the worst performer)
Week 3 (Further Optimization):
Continue refining by:
- Increasing Landing Page A to 60% of traffic
- Reducing Landing Page B to 30%
- Minimizing Landing Page C to just 10%
- While keeping it active to monitor for any changes in performance
4. Monitor Key Performance Indicators
Track these metrics to optimize distribution:
- Click-through rate (CTR) – Landing page effectiveness
- Conversion rate – Offer performance
- Cost per acquisition (CPA) – Profitability metric
- Return on ad spend (ROAS) – Overall campaign efficiency
5. Seasonal Adjustments
Modify how trackers distribute traffic between landing pages and offers based on seasonal trends:
- Holiday seasons: Increase weights for seasonal landing pages
- Product launches: Prioritize new offer variations
- Promotional periods: Adjust for time-sensitive offers
Common Distribution Mistakes to Avoid
Mistake #1: Premature Optimization
Problem: Adjusting weights before gathering sufficient data
Solution: Wait for statistical significance before making changes to how the ad tracker distribute traffic between landing pages and offers
Mistake #2: Neglecting Mobile Optimization
Problem: Using desktop-optimized landing pages for mobile traffic
Solution: Create device-specific landing pages and distribution rules
Mistake #3: Ignoring Traffic Quality
Problem: Focusing only on volume without considering traffic source quality
Solution: Segment distribution by traffic source quality metrics
Mistake #4: Over-Complicating Distribution
Problem: Creating overly complex distribution schemes with too many variants
Solution: Start simple and add complexity based on data insights
Mistake #5: Static Distribution Settings
Problem: Setting shares once and never adjusting
Solution: Regularly review and optimize how trackers distribute traffic between landing pages and offers
Advanced Analytics and Reporting
Understand your complete traffic flow:
Starting with 1,000 clicks from your traffic source, the tracker distributes them across landing pages:
- 500 clicks (50%) go to LP-A
- 300 clicks (30%) to LP-B
- 200 clicks (20%) to LP-C
The landing page engagement shows:
- LP-A generates 150 click-throughs for a 30% CTR
- LP-B produces 120 click-throughs for a 40% CTR
- LP-C yields 60 click-throughs for a 30% CTR
| Landing Page | Clicks Received | Click-Throughs | CTR (%) |
|---|---|---|---|
| LP-A | 500 | 150 | 30 |
| LP-B | 300 | 120 | 40 |
| LP-C | 200 | 60 | 30 |
These 330 total click-throughs are then distributed between offers, with:
- 165 visitors (50%) going to Offer-1
- 165 visitors (50%) to Offer-2
Finally, conversions show:
- Offer-1 converting 15 times for a 9.1% conversion rate
- Offer-2 converts 20 times for a 12.1% conversion rate
| Offer | Visitors Received | Conversions | Conversion Rate (%) |
|---|---|---|---|
| Offer-1 | 165 | 15 | 9.1 |
| Offer-2 | 165 | 20 | 12.1 |
Performance Segmentation
Analyze how ad trackers distribute traffic between landing pages and offers across different segments:
By Traffic Source:
- Facebook traffic routed through LP-Social to Offer-Social achieves a 5% conversion rate
- Google Ads traffic through LP-Search to Offer-Search performs better at 8% CR
- Native Ads traffic through LP-Content to Offer-Content converts at 3% CR
By Device:
- Mobile traffic directed to Mobile LP and then Mobile Offer converts at 4%
- Desktop traffic through Desktop LP to Desktop Offer achieves 7% CR
- Tablet traffic via Tablet LP to Tablet Offer performs at 5% CR
By Geography:
- US traffic through US LP to US Offer converts at 6%
- UK traffic via UK LP to UK Offer achieves 5% CR
- CA traffic through CA LP to CA Offer converts at 4% CR
| Segment Type | Segment | Landing Page → Offer | Conversion Rate (%) |
|---|---|---|---|
| Device | Desktop | Desktop LP → Desktop Offer | 7 |
| Device | Tablet | Tablet LP → Tablet Offer | 5 |
| Geography | US | US LP → US Offer | 6 |
| Geography | UK | UK LP → UK Offer | 5 |
| Geography | CA | CA LP → CA Offer | 4 |
Real-World Case Study
Campaign Overview
Objective: Optimize a weight loss offer campaign
Initial Setup:
- 3 landing pages with equal distribution (33.33% each)
- 2 offers with equal distribution (50% each)
- Traffic source: Facebook Ads
- Budget: $1,000/day
Week 1: Data Collection
Understanding baseline performance of how trackers distribute traffic between landing pages and offers:
- Landing Page A received 1,000 clicks and generated 250 click-throughs for a 25% CTR
- Landing Page B also received 1,000 clicks but performed better with 350 click-throughs for a 35% CTR
- Landing Page C received 1,000 clicks and generated 200 click-throughs for a 20% CTR
For the offers:
- Offer 1 received 400 conversions with a $50 payout, achieving an 8% conversion rate
- Offer 2 generated 300 conversions with a $45 payout for a 6% conversion rate
Week 2: First Optimization
Adjusted distribution based on performance:
Landing page distribution changed to:
- Landing Page A was decreased to 30% of traffic
- Landing Page B was increased to 50% as the best performer
- Landing Page C was decreased to 20% as the worst performer
Offer distribution adjusted to:
- Offer 1 was increased to 60% due to its better conversion rate
- Offer 2 was decreased to 40%
Results:
- Overall CTR improved from 26.7% to 29.5%
- Conversion rate improved from 7% to 8.5%
- Daily profit increased by 23%
Week 3-4: Advanced Optimization
Implemented device-specific distribution for how ad trackers distribute traffic between landing pages and offers.
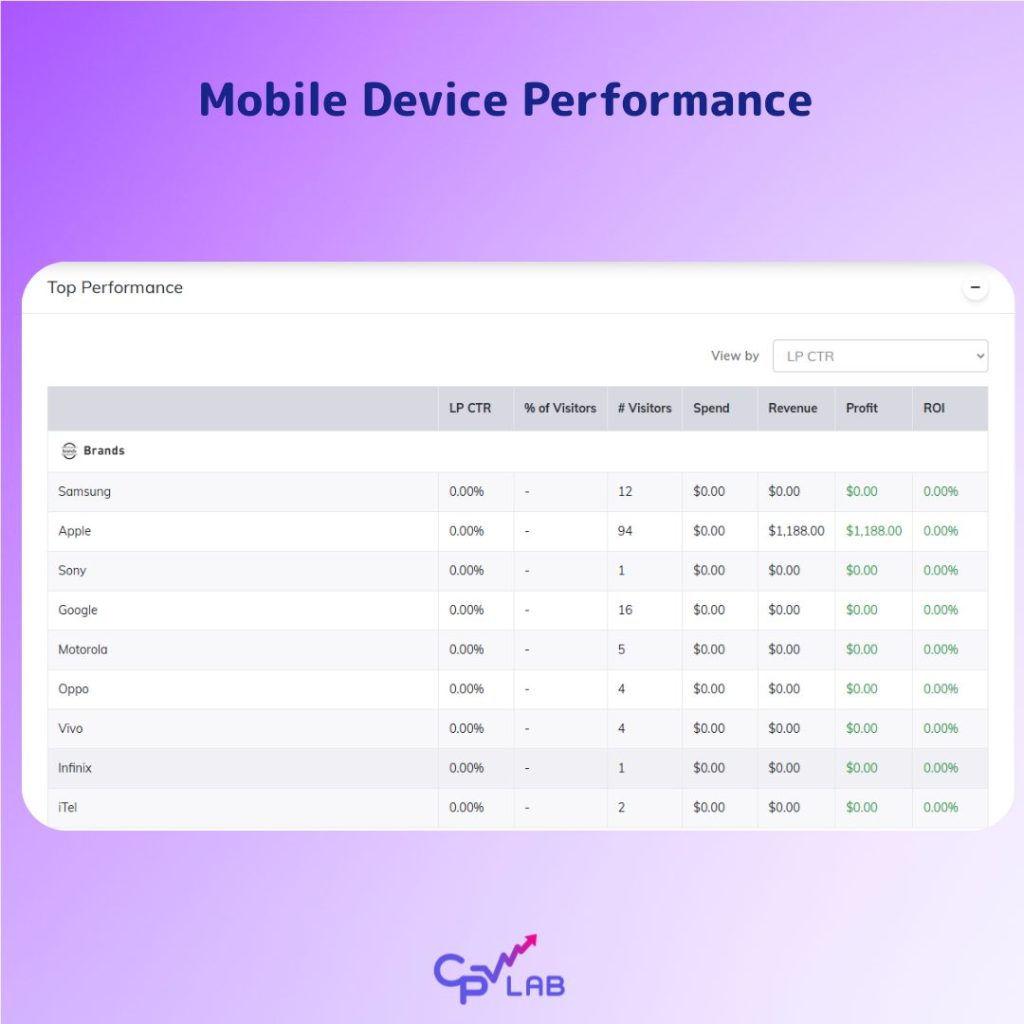
Check first your Mobile device report in CPV Lab or CPV One.
For mobile traffic, which represented 70% of total volume:
- 80% was directed to Mobile LP B
- 20% to Mobile LP A
For desktop traffic, accounting for 30% of the total:
- 70% went to Desktop LP B
- 30% to Desktop LP A
Final Results:
- Mobile CTR: 32% (up from 24%)
- Desktop CTR: 28% (up from 26%)
- Overall ROI: 185% (up from 125%)
Future Trends in Traffic Distribution
AI-Powered Distribution
Machine learning algorithms are revolutionizing how ad trackers distribute traffic between landing pages and offers:
- Predictive modeling for conversion likelihood
- Real-time optimization without manual intervention
- Pattern recognition across multiple campaigns
CPV Version 13 comes with AI Smart Rotation, a way to automatically rotate landing pages and offers based on their performance.
Privacy-Compliant Tracking
With increasing privacy regulations:
- First-party data focus for distribution decisions
- Cookieless tracking implementations
- Consent-based optimization frameworks
CPV Lab uses custom tracking domains to ensure first party data is collected. This means you collect first party data and avoid ad blockers to block your tracking domains.
Conclusion
Understanding how ad trackers distribute traffic between landing pages and offers is essential for modern digital marketing success.
By implementing proper tracking infrastructure, configuring intelligent distribution rules, and continuously optimizing based on performance data, marketers can significantly improve campaign outcomes.
Key takeaways for mastering how trackers distribute traffic between landing pages and offers:
- Start with equal distribution to gather unbiased baseline data
- Implement proper tracking at every stage of the funnel
- Use weight-based (shares %) systems for flexible traffic allocation
- Optimize gradually based on statistical significance
- Segment your analysis by device, geography, and traffic source
- Monitor performance continuously and adjust accordingly
- Test systematically using A/B and multivariate frameworks
By following these principles and best practices, you’ll maximize the effectiveness of your campaigns and achieve better returns on your advertising investment.
The sophisticated control that modern ad trackers provide over how traffic flows through your funnels represents a significant competitive advantage for marketers who master these systems.
Whether you’re running small-scale affiliate campaigns or managing enterprise-level advertising operations, the ability to precisely control how trackers distribute traffic between landing pages and offers will remain a critical skill in the digital marketing landscape.
Start tracking your split tests today with CPV Lab!
Author: Elizabeta Kuzevska
Elizabeta is a certified Digital marketer and Email strategist. With 15+ years of experience in digital marketing, she helps B2B companies boost their online presence through digital strategies, strategic email marketing, & SEO content marketing. As founder and CEO of Online Marketing Academy and co-founder of Lead Gen Marketing, she is passionate about learning from and supporting others.